Running computations on the Torque cluster
Warning
Information on this page is no longer up-to-date as the DCCN Technical Group is working toward phasing out the Torque cluster in 2025. Please migrate as soon as possible to the Slurm cluster. See Running computations on the Slurm cluster.
What is the Torque cluster?
The Torque cluster is a pool of high-end computers (also referred to as compute nodes) managed by a resource manager called Torque and a job scheduler called Moab. Instead of allowing users to login to one computer and run computations freely, user submit their computations in forms of jobs to the Torque cluster. A sketch in the picture below summarises how jobs are being managed by the Torque server and scheduled by its companion, the Moab server, to perform computations on the compute nodes in the cluster.
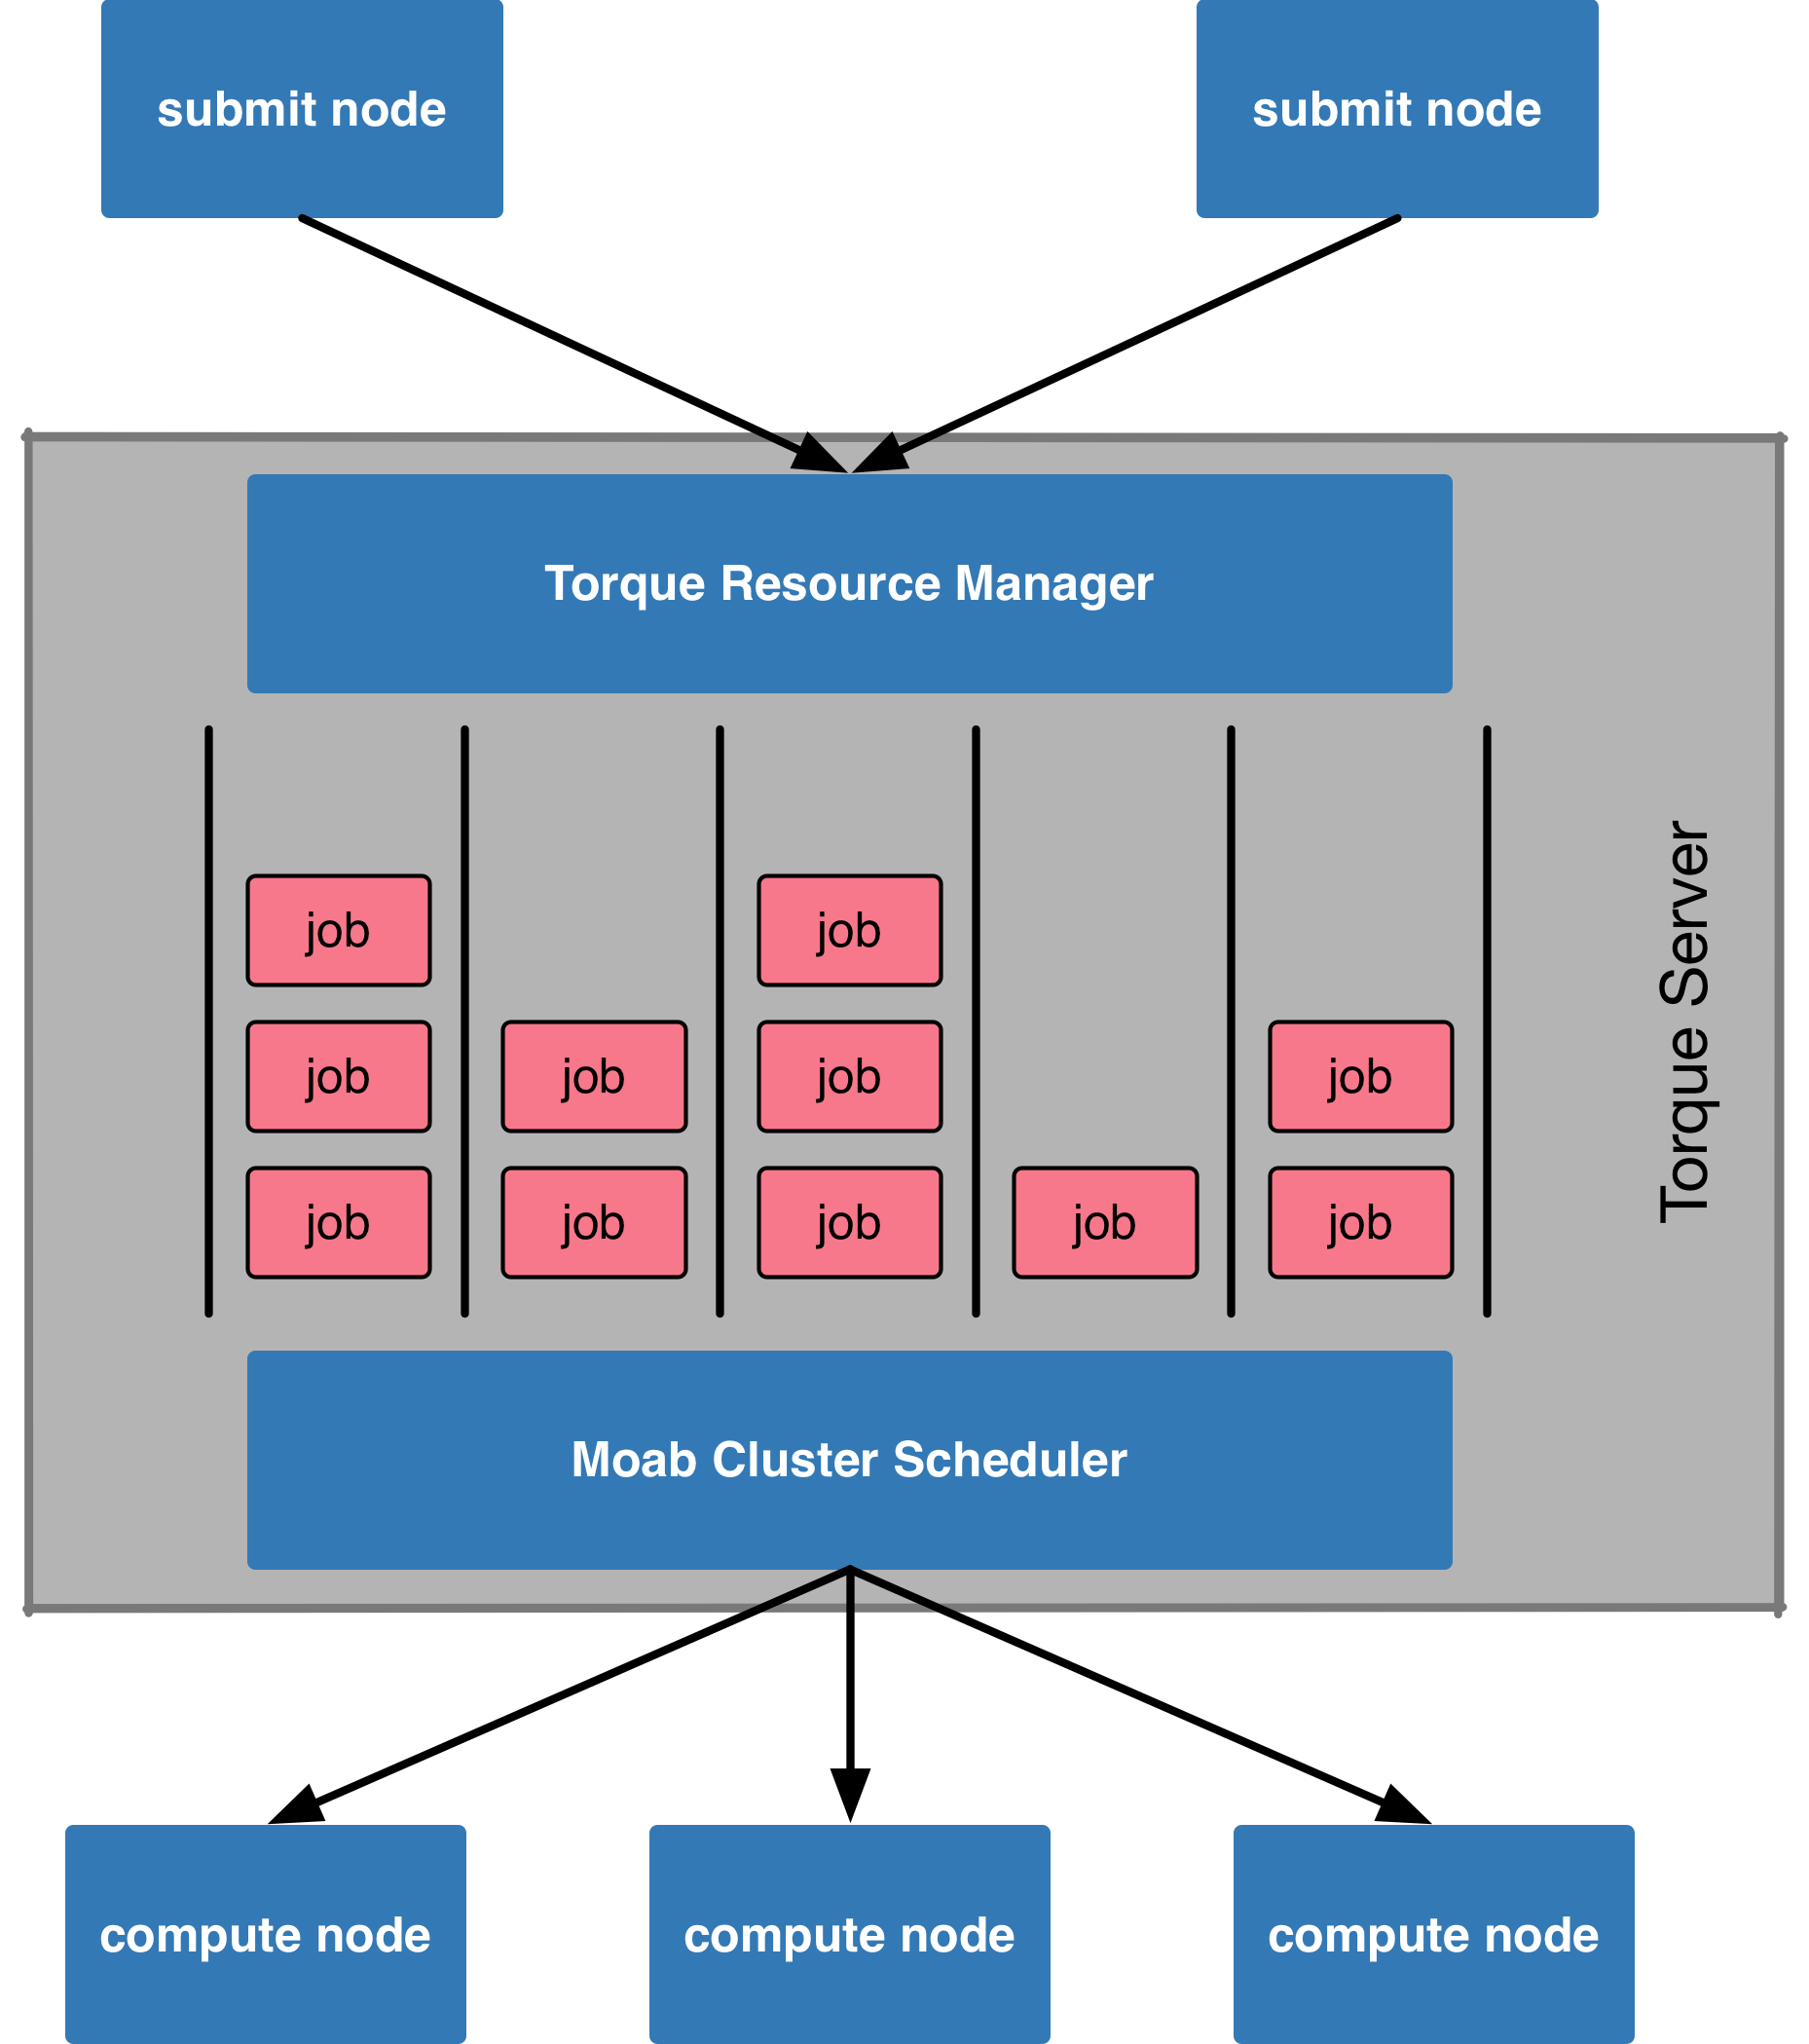
Figure: a simplified view of the torque cluster architecture.
Every job is submitted to the Torque cluster with a set of resource requirement (e.g. duration of the computation, number of CPU cores, amount of RAM, etc.). Based on the requirement, jobs are arranged internally in job queues. The Moab scheduler is responsible for prioritising jobs and assign them accordingly to compute nodes on which the jobs’ requirements are fulfilled. The system also guarantees dedicated resources for the computation. Thus, interference between different computations is minimised, resulting in more predictable job completion time.
Resource sharing and job prioritisation
For optimising the utilisation of the resources of the Torque cluster, certain resource-sharing and job prioritisation policies are applied to jobs submitted to the cluster. The implications to users can be seen from the the three aspects: job queues, throttling policies for resource usage and job prioritisation.
Job queues
In the cluster, several job queues are made available in order to arrange jobs by resource requirements. Those queues are summarised in the table below. Queues are mainly distinguished by the wall time and memory limitations. Some queues, such as matlab, vgl and interactive, have their own special purpose for jobs with additional resource requirements.
queue name |
routing queue |
max. walltime per job |
max. memory per job |
special feature |
job priority |
|---|---|---|---|---|---|
matlab |
N/A |
48 hours |
256 GB |
matlab license |
normal |
vgl |
N/A |
8 hours |
10 GB |
VirtualGL capability |
normal |
bigscratch |
N/A |
72 hours |
256 GB |
local disk space |
normal |
short |
N/A |
2 hours |
8 GB |
normal |
|
veryshort |
N/A |
20 minutes |
8 GB |
normal |
|
long |
automatic |
24 hours |
64 GB |
normal |
|
batch |
automatic |
48 hours |
256 GB |
normal |
|
verylong |
automatic |
72 hours |
64 GB |
normal |
|
interactive |
automatic |
72 hours |
64 GB |
user interaction |
high |
lcmgui |
N/A |
72 hours |
64 GB |
interactive LCModel |
high |
At the job submission time, user can specify to which queue the job should be placed in the system. Alternatively, one could simply specify the wall time and memory required by the job and let the system pick up a most proper queue automatically for the job. The second approach is implemented by the automatic queue behaving as a router to a destination queue.
Throttling policies for resource usage
In the Torque cluster at DCCN, throttle policies are applied to limit the amount of resources an user can allocate at the same time. It is to avoid resources of the entire cluster being occupied by a single user. The policies are defined in two scopes:
Queue-wise policies
For every job queue, the total number of runnable and queue-able jobs per user are throttled. In the table below, the max. runnable jobs specifies the maximum number of running jobs a user is allowed to have in a queue at a given time; while the max. queueable jobs restricts the total number of jobs (including idle, running and blocked jobs) a user is allowed to have.
queue name
max. runnable jobs
max. queue-able jobs
matlab
400
2000
bigscratch
400
2000
short
400
2000
veryshort
400
2000
long
400
2000
batch
400
2000
verylong
400
2000
vgl
2
5
interactive
2
4
lcmgui
2
4
For most of queues, the number of runnable and queue-able jobs are set to 300 and 2000, respectively. However, more restricted policies are applied to jobs in the vgl, interactive and lcmgui queues. For jobs in the vgl queue, the maximum runnable and queue-able jobs are set to 2 and 5, respectively; while they are 2 and 4 for jobs in the interactive and the lcmgui queues. This is to compensate for the facts that vgl jobs consume lots of the network bandwidth; and interactive and lcmgui jobs always have the highest priority to start. Furthermore, the lcmgui jobs are always assigned to the node on which the LCModel license is installed.
Cluster-wise policies
The cluster-wise throttling is to limit the total amount of resources a single user can occupy at the same time in the cluster. The three upper-bound (cluster-wise) limitations are:
400 jobs
660 days processing (wall)time
1 TB memory
The cluster-wise policies overrule the queue-wise policies. It implies that if the resource utilisation of your current running jobs reaches one of the cluster-wise limitations, your additional jobs have to wait in the queue even there are still available resources in the cluster and you are not rearching the queue-wise limitations.
Job prioritisation
Job priority determines the order of waiting jobs to start in the cluster. Job priority is calculated by the Moab scheduler taking into account various factors. In the cluster at DCCN, mainly the following two factors are considered.
The waiting time a job has spent in the queue: this factor will add one additional priority point to jobs waiting for one additional minute in the queue.
Queue priority: this factor is mainly used for boosting jobs in the interactive queue with an outstanding priority offset so that they will be started sooner than other types of jobs.
The final job priority combining the two factors is used by the scheduler to order the waiting jobs accordingly. The first job on the ordered list is the next to start in the cluster.
Note: Job priority calculation is dynamic and not complete transparent to users. One should keep in mind that the cluster does not treat the jobs as “first-come first-serve”.
Job management workflow
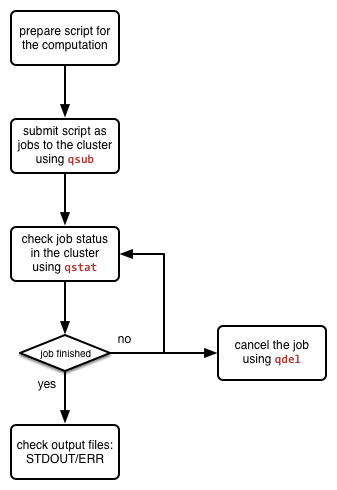
Figure: the generic job management workflow.
The Torque system comes with a set of command-line tools for users to manage jobs in the cluster. These tools are generic and can be utilised for running various types of analysis jobs. The picture on the left shows a general job management lifecycle when running your computations in the cluster. The three mostly used tools during the job management lifecycle are: qsub for submitting jobs to the cluster, qstat for checking jobs’ status in the cluster, and qdel for cancelling jobs. The usage of them are given below.
Batch job submission
The qsub command is used to submit jobs to the Torque job manager. The first and simplest way of using qsub is pipelining a command-line string to it. Assuming that we want to display the hostname of the compute node on which the job will run, we issue the following command:
$ echo '/bin/hostname -f' | qsub -l 'nodes=1:ppn=1,mem=128mb,walltime=00:10:00'
Here we echo the command we want to run (i.e. /bin/hostname -f) as a string, and pass it to qsub as the content of our job. In addition, we also request for resources of 1 processor with 128 megabytes RAM for a walltime of 10 minute, using the -l option.
In return, you will receive an unique job identifier similar to the one below.
6278224.dccn-l029.dccn.nl
It is “the” identifier to be used for tracing the job’s progress and status in the cluster. We will show it later; for the moment, we continue with a different way of using the qsub command.
It is more realistic that our computation involves a set of commands to be executed sequentially. A more handy way is to compose those commands into a BASH script and hand the script over to the qsub command. Assuming we have made a script called my_analysis.sh right in the present working directory (i.e. PWD), we can then submit this script as a job via the following command:
$ qsub -l 'nodes=1:ppn=1,mem=128mb,walltime=00:10:00' ${PWD}/my_analysis.sh
It is very often that the same analysis needs to be repeated on many datasets, each corresponds to, for example, a subject. It would be smart to implement the bash script with additional arguments to switch between datasets. Assuming that the my_analysis.sh is now implemented to take one argument as the subject index, submitting the script to run on the dataset of subject 001 would look like the example below:
$ echo "${PWD}/my_analysis.sh 001" | qsub -N 's001' -l 'nodes=1:ppn=1,mem=128mb,walltime=00:10:00'
Note
The command above for passing argument to script is actually a workaround as qsub (of currently installed version) does not provide options to deal with the command arguments.
Interactive computation in text mode
It is possible to acquire a Linux shell of an compute node for running computations interactively. It is done by submitting the so-called interactive jobs. To submit an interactive job, one adds an additional -I option of the qsub command:
$ qsub -I -l 'nodes=1:ppn=1,mem=128mb,walltime=00:10:00'
In few seconds, a message similar to the one below will show up in the terminal.
 1qsub: waiting for job 6318221.dccn-l029.dccn.nl to start
 2qsub: job 6318221.dccn-l029.dccn.nl ready
 3
 4----------------------------------------
 5Begin PBS Prologue Tue Aug  5 13:31:05 CEST 2014 1407238265
 6Job ID:                6318221.dccn-l029.dccn.nl
 7Username:      honlee
 8Group:                 tg
 9Asked resources:   nodes=1:ppn=1,mem=128mb,walltime=00:10:00,neednodes=1:ppn=1
10Queue:                 interactive
11Nodes:                 dccn-c351
12End PBS Prologue Tue Aug  5 13:31:05 CEST 2014 1407238265
13----------------------------------------
14honlee@dccn-c351:~
The shell prompt on line 14 shows that you are now logged into an compute node (i.e. dccn-c351). You can now run the computation interactively by typing a command after the prompt.
Note: the resource usage of interactive job is also monitored by the Torque system. The job will be killed (i.e. you will be kicked out the shell) when the computation runs over the amount of the resources requested at the job submission time.
Interactive computation in graphic mode
Inteactive computation in graphic mode is actually achieved by submitting a batch job to run the graphical application on the execute node; but when the application runs, it shows the graphic interface remotely on the cluster’s access node. Therefore, it requires you to connect to the cluster’s access node via VNC.
Assuming we want to run FSL interactively through its graphical menu, we use the following commands:
$ xhost +
$ echo "export DISPLAY=${HOSTNAME}${DISPLAY}; fsl" | qsub -q interactive -l 'nodes=1:ppn=1,mem=128mb,walltime=00:10:00'
The first command allows graphic interfaces on any remote host to be displayed on the access node. The second command submit a job to firstly set the compute node to forward graphic interfaces to the access node before launching the FSL executable.
Checking job status
Every submitted job in the cluster is referred by an unique identifier (i.e. the job id). It is “the” reference allowing system and users to trace the progress of a particular job in the cluster. The system also maintains a set of historical jobs (i.e. jobs finished in last 12 hours) that can be also queried by users using the qstat command.
To get a list of jobs submitted by you, simply run
$ qstat
If you have jobs in the system, you will get a table similar to the one below:
job id                    Name             User            Time Use S Queue
------------------------- ---------------- --------------- -------- - -----
6318626.dccn-l029          matlab           honlee          00:00:00 C matlab
6318627.dccn-l029          matlab           honlee          00:00:00 C matlab
6318630.dccn-l029          STDIN            honlee          00:00:01 C matlab
6318631.dccn-l029          STDIN            honlee          00:00:01 C interactive
In the able, the colume Time Use indicates the CPU time utilisation of the job, while the job status is presented in the column S with a flag of a capital letter. Possible job-status flags are summarised below:
H: job is held (by the system or the user)
Q: job is queued and eligible to run
R: job is running
E: job is exiting after having run
C: job is completed after having run
Tip
There are many options supported by qstat. For example, one can use -i to list only jobs waiting in the queue. More options can be found via the online document using man qstat.
Cancelling jobs
Cancelling jobs in the cluster is done with the qdel command. For example, to cancel a job with id 6318635, one does
$ qdel 6318635
Note
You cannot cancel jobs in status exiting (E) or completed (C).
Output streams of the job
On the compute node, the job itself is executed as a process in the system. The default STDOUT and STDERR streams of the process are redirected to files named as <job_name>.o<job_id_digits> and <job_name>.e<job_id_digits>, respectively. After the job reachers the complete state, these two files will be produced on the file system.
Tip
The STDOUT and STDERR files produced by job usually provide useful information for debugging issues with the job. Always check them first when your job is failed or terminated unexpectedly.
Specifying resource requirement
Each job submitted to the cluster comes with a resource requirement. The job scheduler and resource manager of the cluster make sure that the needed resources are allocated for the job. To allow the job to complete successfully, it is important that a right and sufficient amount of resources are specified at the job submission time.
When submitting jobs with the qsub command, one uses the -l option to specify required resources. The value of the -l option follows certain syntax. Detail of the syntax can be found on the Torque documentation. Hereafter are few useful, and mostly used examples for jobs requiring:
Warning
The examples below only show the option of the qsub command for resource specification (-l); therefore they are NOT complete commands. You need to make the command complete by adding either a -I option for an interactive job or passing a script to be run as a batch job.
1 CPU core, 4 gigabytes memory and 12 hours wallclock time
$ qsub -l 'walltime=12:00:00,mem=4gb' job.sh
The requirement of 1 CPU is skipped as it is by default to be 1.
4 CPU cores on a single node, 12 hours wallclock time, and 4 gb memory
$ qsub -l 'nodes=1:ppn=4,walltime=12:00:00,mem=4gb' job.sh
Here we explicitly ask 4 CPU cores to be on the same compute node. This is usually a case that the application (such as multithreading of MATLAB) can benefit from multiple cores on a (SMP) node to speed up the computation.
1 CPU core, 500gb of free local “scratch” diskspace, 12 hours wallclock time, and 4 gb memory
$ qsub -l 'file=500gb,walltime=12:00:00,mem=4gb' job.sh
Here we explicitly ask for 500gb of job-specific scratch space on the compute node. This could for instance be asked for when submitting an fmriprep job that requires lots of local diskspace for computation. The more jobs are running, the longer it can take for torque to find a node with enough free diskspace to run the job. Max to request for is 3600gb.
Note
In case you use more than the requested 500gb there will be no penalty. Diskspace is monitored, but your job won’t fail if the requested diskspace is “overused”, as long as diskspace is available. Of course if no more diskspace is available your job will fail.
1 Intel CPU core, 4 gigabytes memory and 12 hours wallclock time, on a node with 10 Gb network connectivity
$ qsub -l 'nodes=1:intel:network10GigE,walltime=12:00:00,mem=4gb' job.sh
Here we ask the allocated CPU core to be on a node with properties intel and network10GigE.
1 AMD EPYC7351 CPU core, 4 gigabytes memory and 12 hours wallclock time
$ qsub -l 'nodes=1:amd:epyc7351,walltime=12:00:00,mem=4gb' job.sh
Here we ask the allocated CPU core to be on a node with properties amd (CPU vendor) and epyc7351 (CPU model).
4 CPU cores, 12 hours wallclock time, and 4 gb memory. The 4 CPU cores may come from different nodes
$ qsub -l 'procs=4,walltime=12:00:00,mem=4gb' job.sh
Here we use procs to specify the amount of CPU cores we need, but not restricting to a single node. In this scenario, the job (or the application the job runs) should take care of the communication between the processors distributed on many nodes. This is typically for the MPI-like applications.
1 GPU with minimal cuda capability 5.0, 12 hours wallclock time, and 4 gb memory
$ qsub -l 'nodes=1:gpus=1,feature=cuda,walltime=1:00:00,mem=4gb,reqattr=cudacap>=5.0'
Here we ask for a 1 GPU on a node with the (dynamic) attribute cudacap set to larger or equal to 5.0. The feature=cuda requirement allows the system to make use of a standing reservation if there is still space available in the reservation.
Note
Currently there are 9 Nvidia Tesla P100 GPUs available in the entire cluster. More GPUs will be added to the cluster in the future.
Estimating resource requirement
As we have mentioned, every job has attributes specifying the required resources for its computation. Based on those attributes, the job scheduler allocates resources for jobs. The more precise these requirement attributes are given, the more efficient the resources are used. Therefore, we encourage all users to estimate the resource requirements before submitting massive jobs to the cluster.
The walltime and memory requirements are the most essential ones amongst others. Hereafter are three different ways to make estimations of those two requirements.
Note
Computing resources in the cluster are reserved for jobs in terms of size (e.g. amount of requested memory and CPU cores) and duration (e.g. the requested walltime). Under-estimating the requirement causes job to be killed before completion and thus the resources have been consumed by the job were wasted; while over-estimating blocks resources from being used efficiently.
Consult your colleages
If your analysis tool (or script) is commonly used in your research field, consulting with your colleagues might be just an efficient way to get a general idea about the resource requirement of the tool.
Monitor the resource consumption (with an interactive test job)
A good way of estimating the wall time and memory requirement is through monitoring the usage of them at run time. This approach is only feasible if you run the job interactively through a graphical interface. Nevertheless, it’s encouraged to test your data analysis computation interactively once before submitting it to the cluster with a large amount of batch jobs. Through the interactive test, one could easily debug issues and measure the resource usage.
Upon the start of an interactive job, a resource comsumption monitor is shown on the top-right corner of your VNC desktop. An example is shown in the following screenshot:
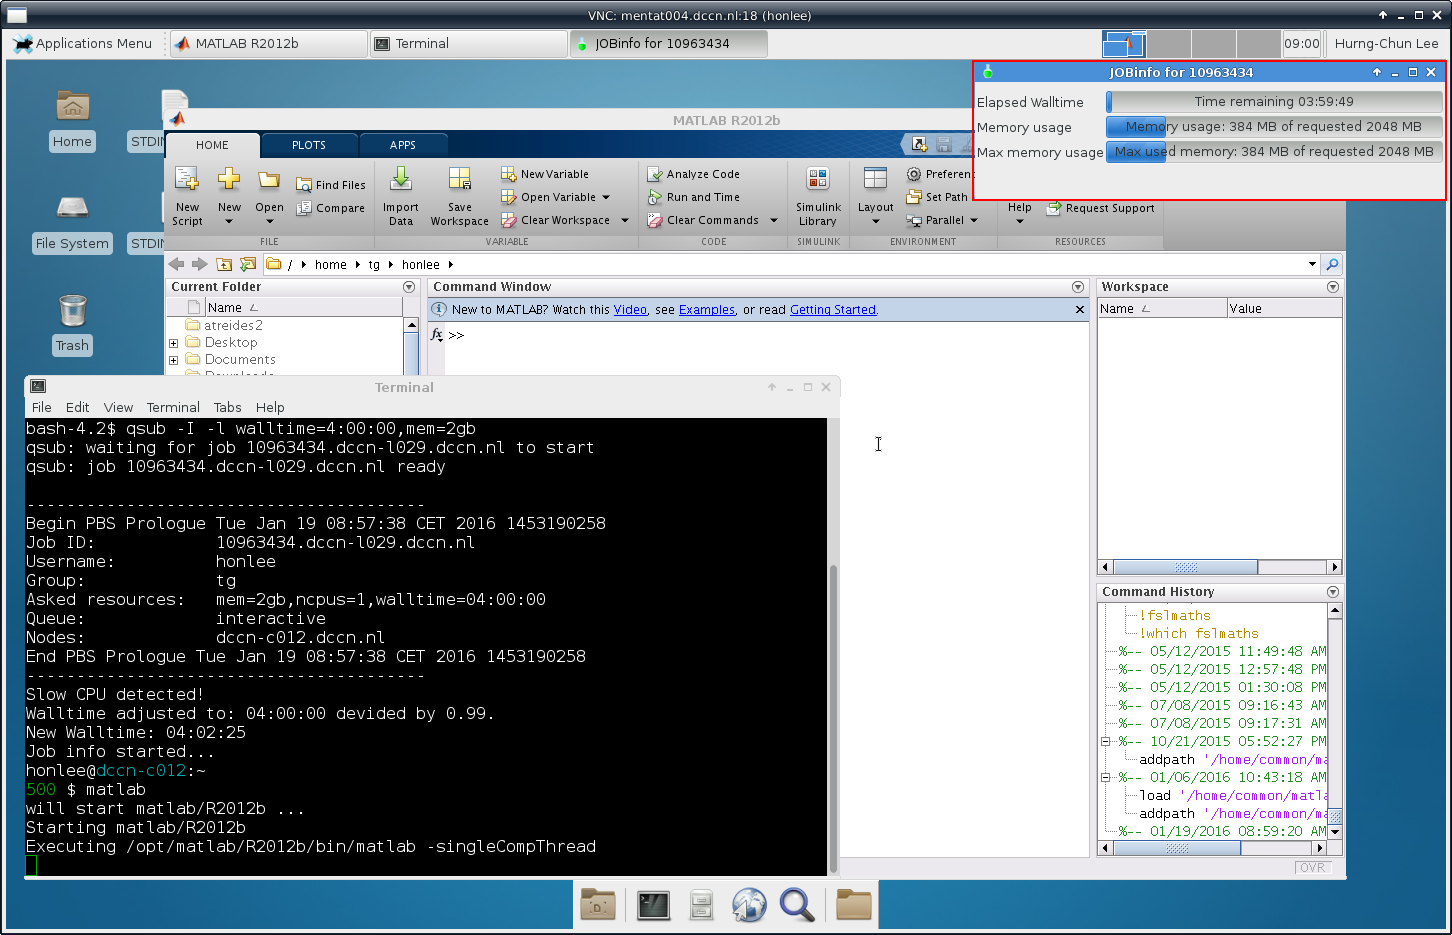
The resource monitor consists of three bars. From top to bottom, they are:
Elapsed walltime: the bar indicates the elasped walltime consumed by the job. It also shows the remaining walltime. The walltime is adjusted accordingly to the CPU speed.
Memory usage: the bar indicates the current memory usage of the job.
Max memory usage: the bar indicates the peak memory usage of the job.
Use the job’s epilogue message (a trial-and-error approach)
The wall time and memory requirements can also be determined with a trial procedure in which the user submits a test job to the cluster with a rough requirement. In the job’s
STDOUTfile (i.e.<job_name>.o<job_id_digits>), you will see an Epilogue message stating the amount of resources being used by the job. In the snippet below, this is shown on line 10. Please also node the job exit code137on line 4. It indicates that job was killed by the system, very likely, due to memory overusage if you see the memory usage reported on line 10 is close to the memory requirement on line 9.1---------------------------------------- 2Begin PBS Epilogue Wed Oct 17 10:18:53 CEST 2018 1539764333 3Job ID: 17635280.dccn-l029.dccn.nl 4Job Exit Code: 137 5Username: honlee 6Group: tg 7Job Name: fake_app_2 8Session: 15668 9Asked resources: walltime=00:10:00,mem=128mb 10Used resources: cput=00:00:04,walltime=00:00:19,mem=134217728b 11Queue: veryshort 12Nodes: dccn-c365.dccn.nl 13End PBS Epilogue Wed Oct 17 10:18:53 CEST 2018 1539764333 14----------------------------------------
Note
In addtion to checking the job’s epilogue file, you will also receive an email notification when the job exceeds the requested walltime.
Adjust the rough requirement gradually based on the usage information and resubmit the test job with the new requirement. In few iterations, you will be able to determine the actual usage of your analysis job. A rule of thumb for specifying the resource requirement for the production jobs is to add on top of the actual usage a 10~20% buffer as a safety margin.
Cluster tools
A set of auxiliary scripts is developed to ease the job management works on the cluster. Those tools are listed below with brief description about their functionalities. To use them, simply type the command in the terminal. You could try to apply the -h or --help option to check if there are more options available.
command |
function |
|---|---|
|
shows job status from the scheduler’s perspective. It is useful for knowing why a job is not started. |
|
lists the compute nodes in the cluster. It is one of the Torque client tools. |
|
retrieve various information about the cluster and jobs. See The HPC utility for more detail about the usage. |